


dockprom
A monitoring solution for Docker hosts and containers with Prometheus, Grafana, cAdvisor, NodeExporter and alerting with AlertManager.
Install
Clone this repository on your Docker host, cd into dockprom directory and run compose up:
git clone https://github.com/stefanprodan/dockprom
cd dockprom

ADMIN_USER='admin' ADMIN_PASSWORD='admin' ADMIN_PASSWORD_HASH='$2a$14$1l.IozJx7xQRVmlkEQ32OeEEfP5mRxTpbDTCTcXRqn19gXD8YK1pO' docker-compose up -d
Caddy v2 does not accept plaintext passwords. It MUST be provided as a hash value. The above password hash corresponds to ADMIN_PASSWORD 'admin'. To know how to generate hash password, refer Updating Caddy to v2
Prerequisites:
- Docker Engine >= 1.13
- Docker Compose >= 1.11
Updating Caddy to v2
Perform a docker run --rm caddy caddy hash-password --plaintext 'ADMIN_PASSWORD' in order to generate a hash for your new password.
ENSURE that you replace ADMIN_PASSWORD with new plain text password and ADMIN_PASSWORD_HASH with the hashed password references in docker-compose.yml for the caddy container.
Containers:
- Prometheus (metrics database)
http://<host-ip>:9090 - Prometheus-Pushgateway (push acceptor for ephemeral and batch jobs)
http://<host-ip>:9091 - AlertManager (alerts management)
http://<host-ip>:9093 - Grafana (visualize metrics)
http://<host-ip>:3000 - NodeExporter (host metrics collector)
- cAdvisor (containers metrics collector)
- Caddy (reverse proxy and basic auth provider for prometheus and alertmanager)
Setup Grafana
Navigate to http://<host-ip>:3000 and login with user admin password admin. You can change the credentials in the compose file or by supplying the ADMIN_USER and ADMIN_PASSWORD environment variables on compose up. The config file can be added directly in grafana part like this
grafana:
  image: grafana/grafana:7.2.0
  env_file:
    - config
and the config file format should have this content
GF_SECURITY_ADMIN_USER=admin
GF_SECURITY_ADMIN_PASSWORD=changeme
GF_USERS_ALLOW_SIGN_UP=false
If you want to change the password, you have to remove this entry, otherwise the change will not take effect
- grafana_data:/var/lib/grafana
Grafana is preconfigured with dashboards and Prometheus as the default data source:
- Name: Prometheus
- Type: Prometheus
- Url: http://prometheus:9090
- Access: proxy
Docker Host Dashboard
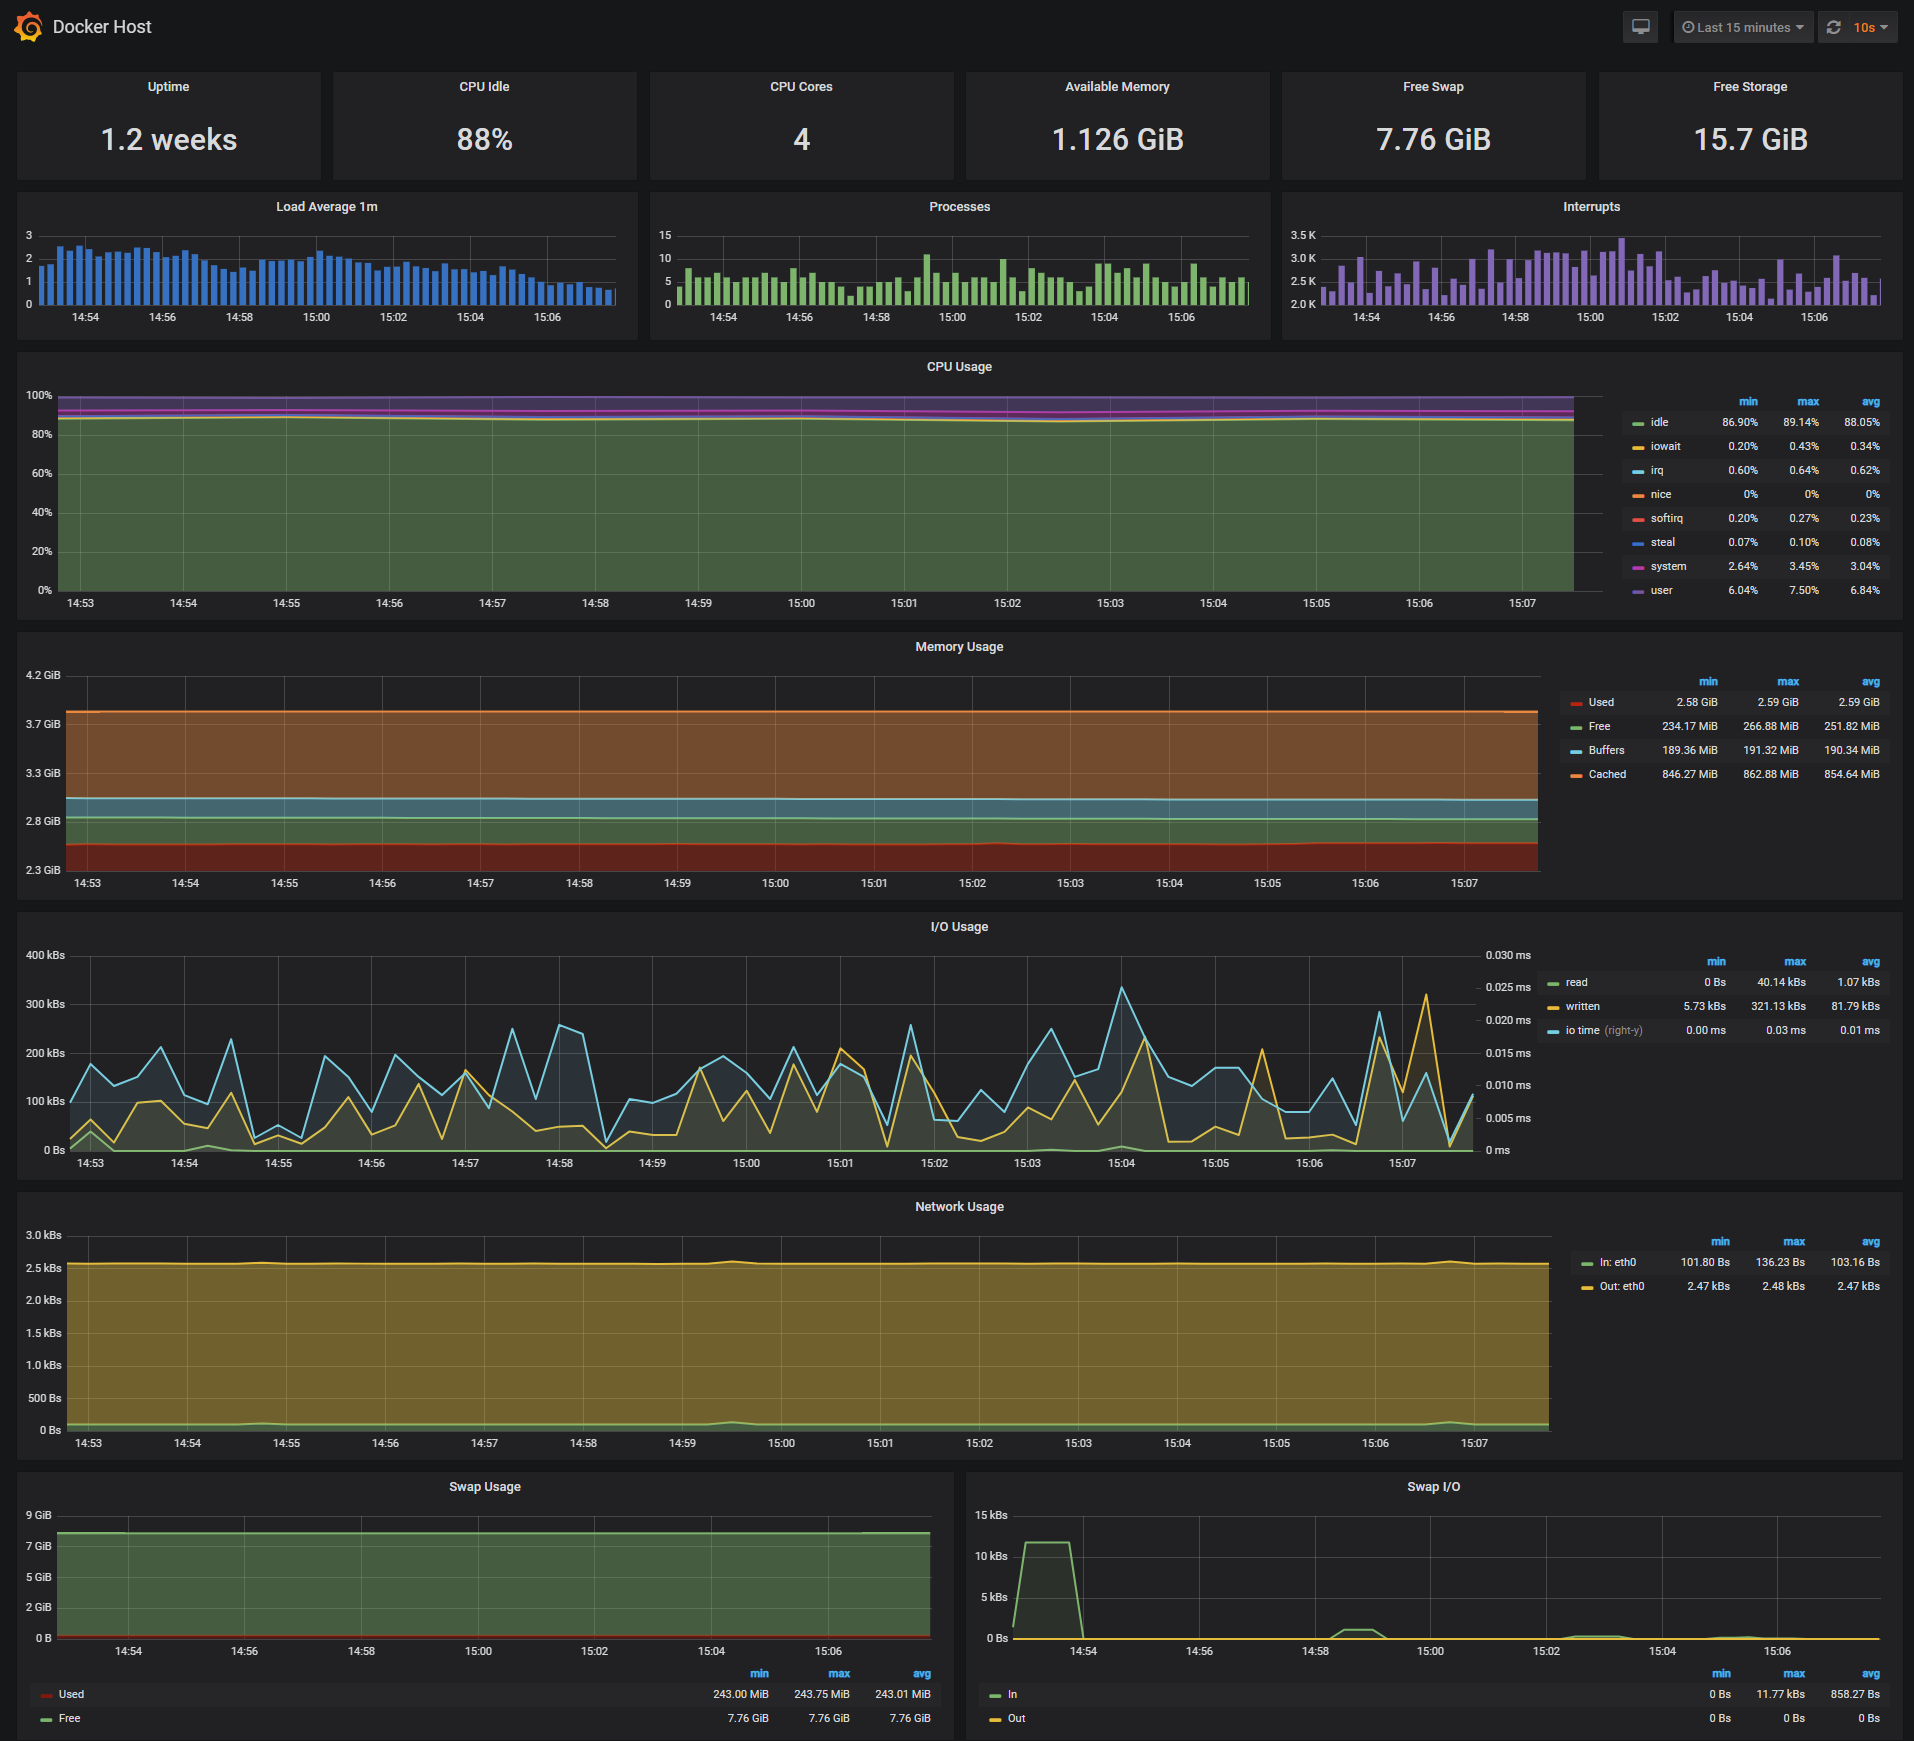
The Docker Host Dashboard shows key metrics for monitoring the resource usage of your server:
- Server uptime, CPU idle percent, number of CPU cores, available memory, swap and storage
- System load average graph, running and blocked by IO processes graph, interrupts graph
- CPU usage graph by mode (guest, idle, iowait, irq, nice, softirq, steal, system, user)
- Memory usage graph by distribution (used, free, buffers, cached)
- IO usage graph (read Bps, read Bps and IO time)
- Network usage graph by device (inbound Bps, Outbound Bps)
- Swap usage and activity graphs
For storage and particularly Free Storage graph, you have to specify the fstype in grafana graph request.
You can find it in grafana/provisioning/dashboards/docker_host.json, at line 480 :
"expr": "sum(node_filesystem_free_bytes{fstype=\"btrfs\"})",
I work on BTRFS, so i need to change aufs to btrfs.
You can find right value for your system in Prometheus http://<host-ip>:9090 launching this request :
node_filesystem_free_bytes
Docker Containers Dashboard
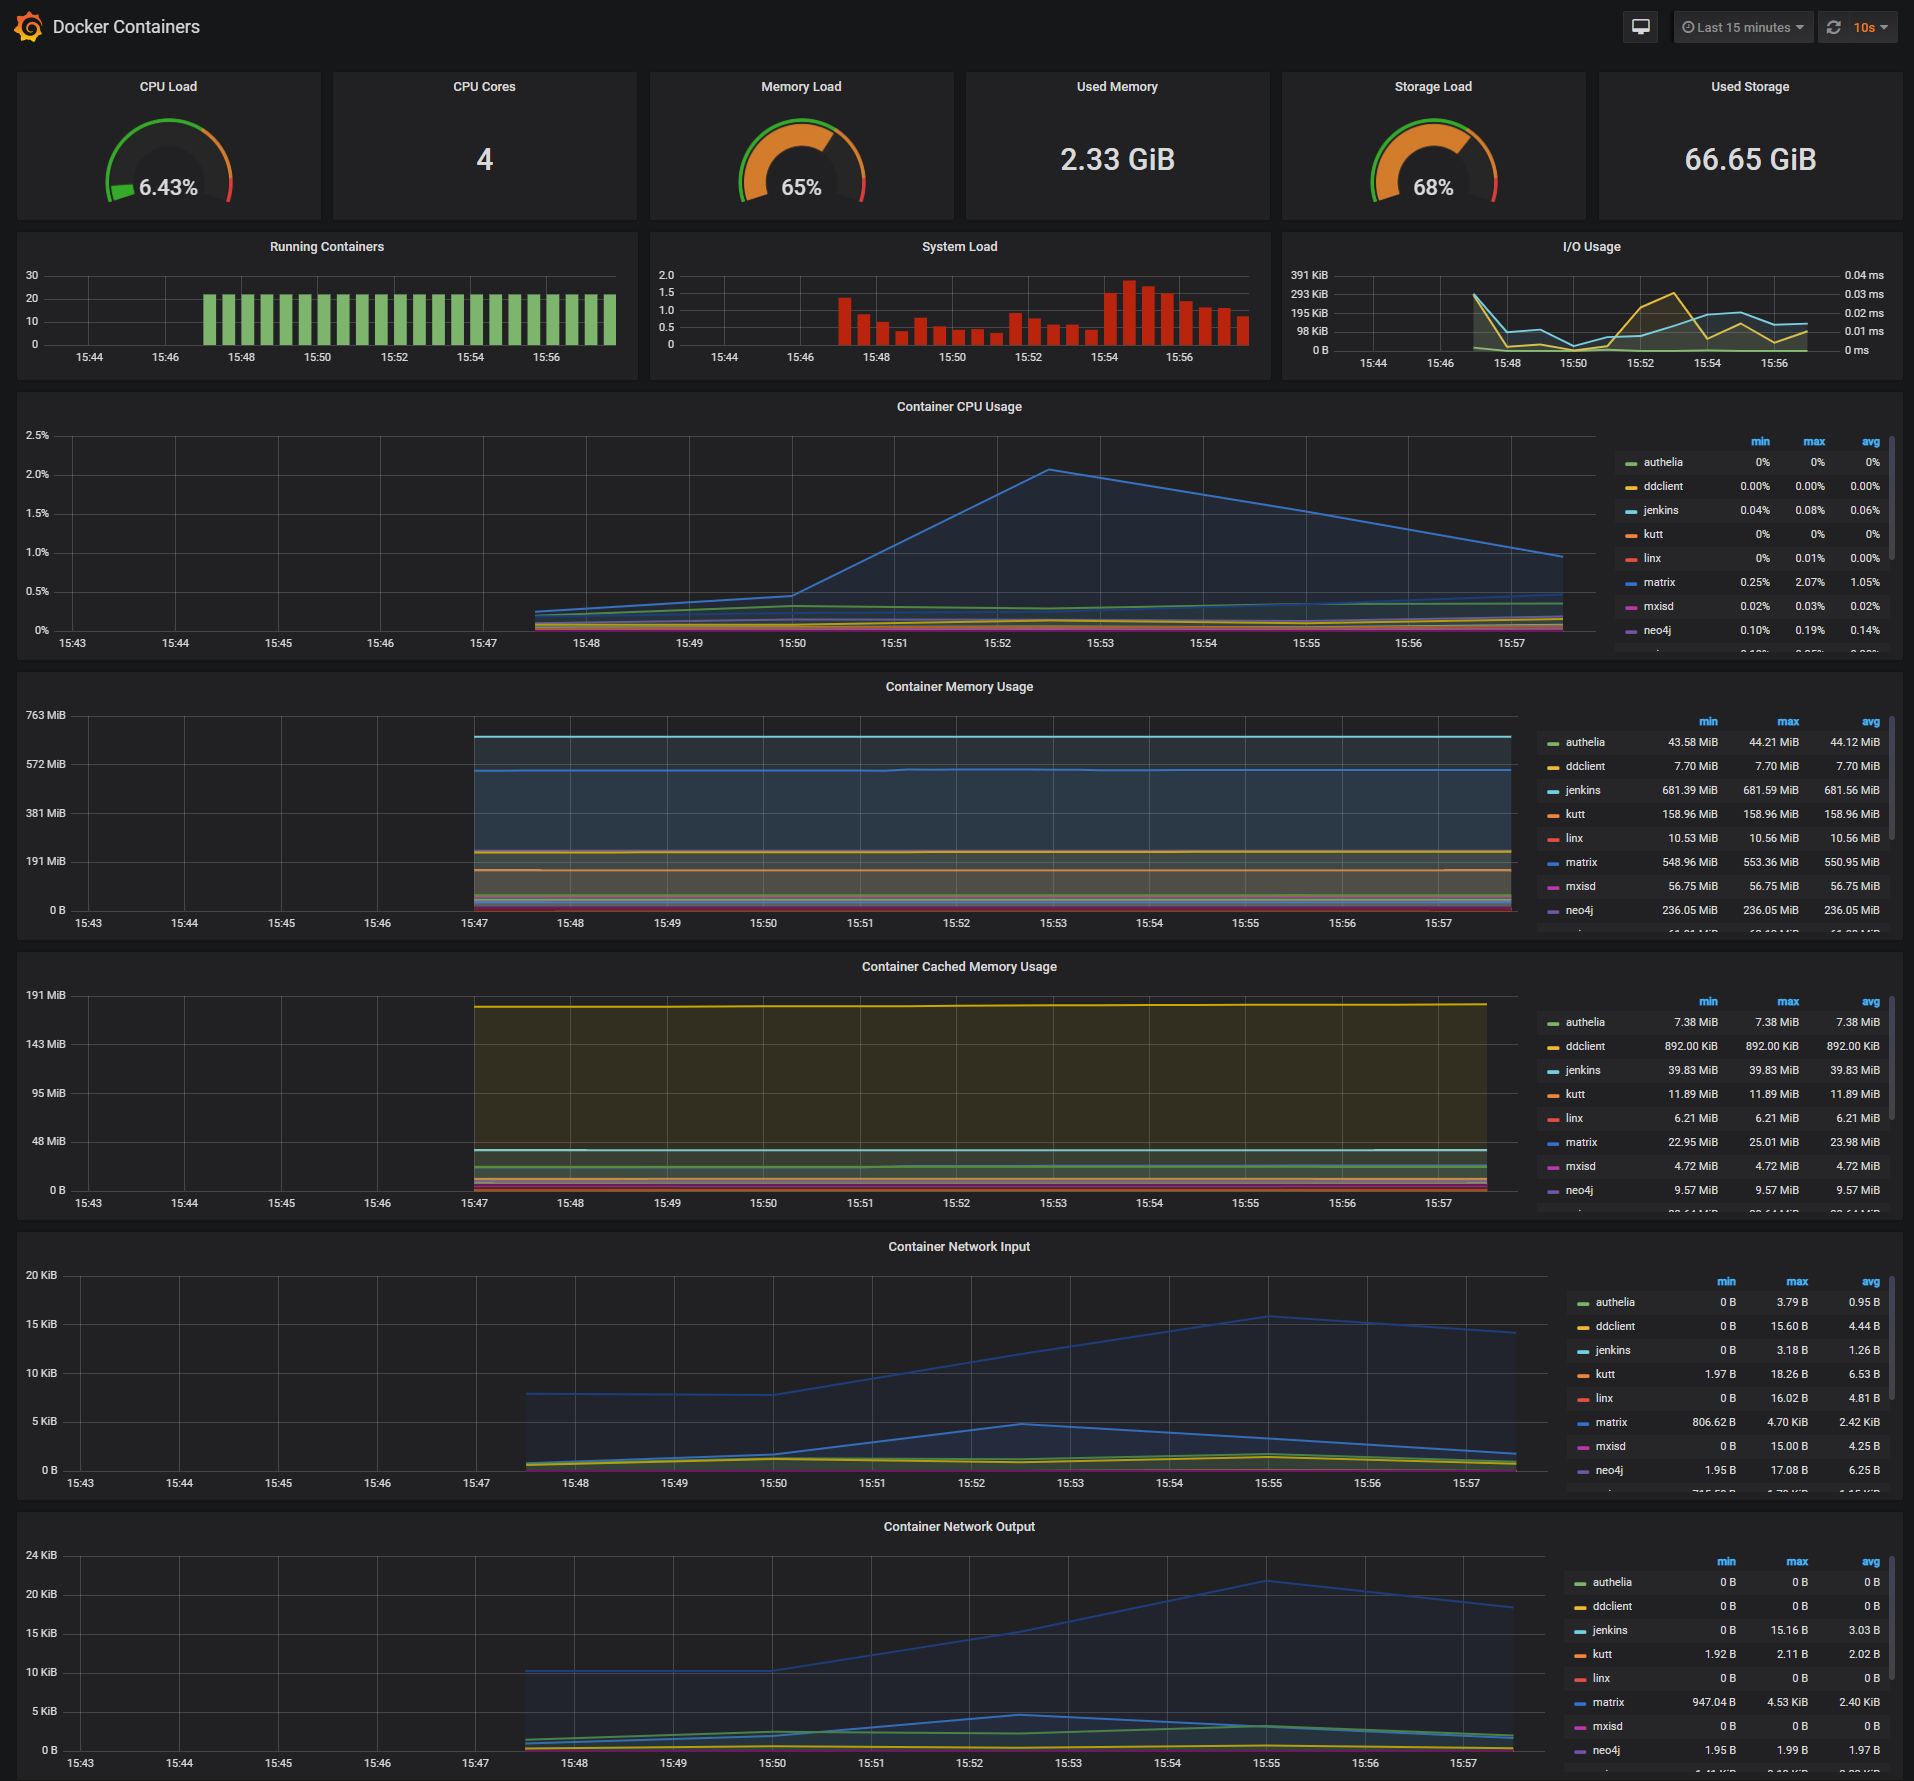
The Docker Containers Dashboard shows key metrics for monitoring running containers:
- Total containers CPU load, memory and storage usage
- Running containers graph, system load graph, IO usage graph
- Container CPU usage graph
- Container memory usage graph
- Container cached memory usage graph
- Container network inbound usage graph
- Container network outbound usage graph
Note that this dashboard doesn't show the containers that are part of the monitoring stack.
For storage and particularly Storage Load graph, you have to specify the fstype in grafana graph request.
You can find it in grafana/provisioning/dashboards/docker_containers.json, at line 406 :
"expr": "(node_filesystem_size_bytes{fstype=\"btrfs\"} - node_filesystem_free_bytes{fstype=\"btrfs\"}) / node_filesystem_size_bytes{fstype=\"btrfs\"} * 100",
I work on BTRFS, so i need to change aufs to btrfs.
You can find right value for your system in Prometheus http://<host-ip>:9090 launching this request :
node_filesystem_size_bytes
node_filesystem_free_bytes
Monitor Services Dashboard
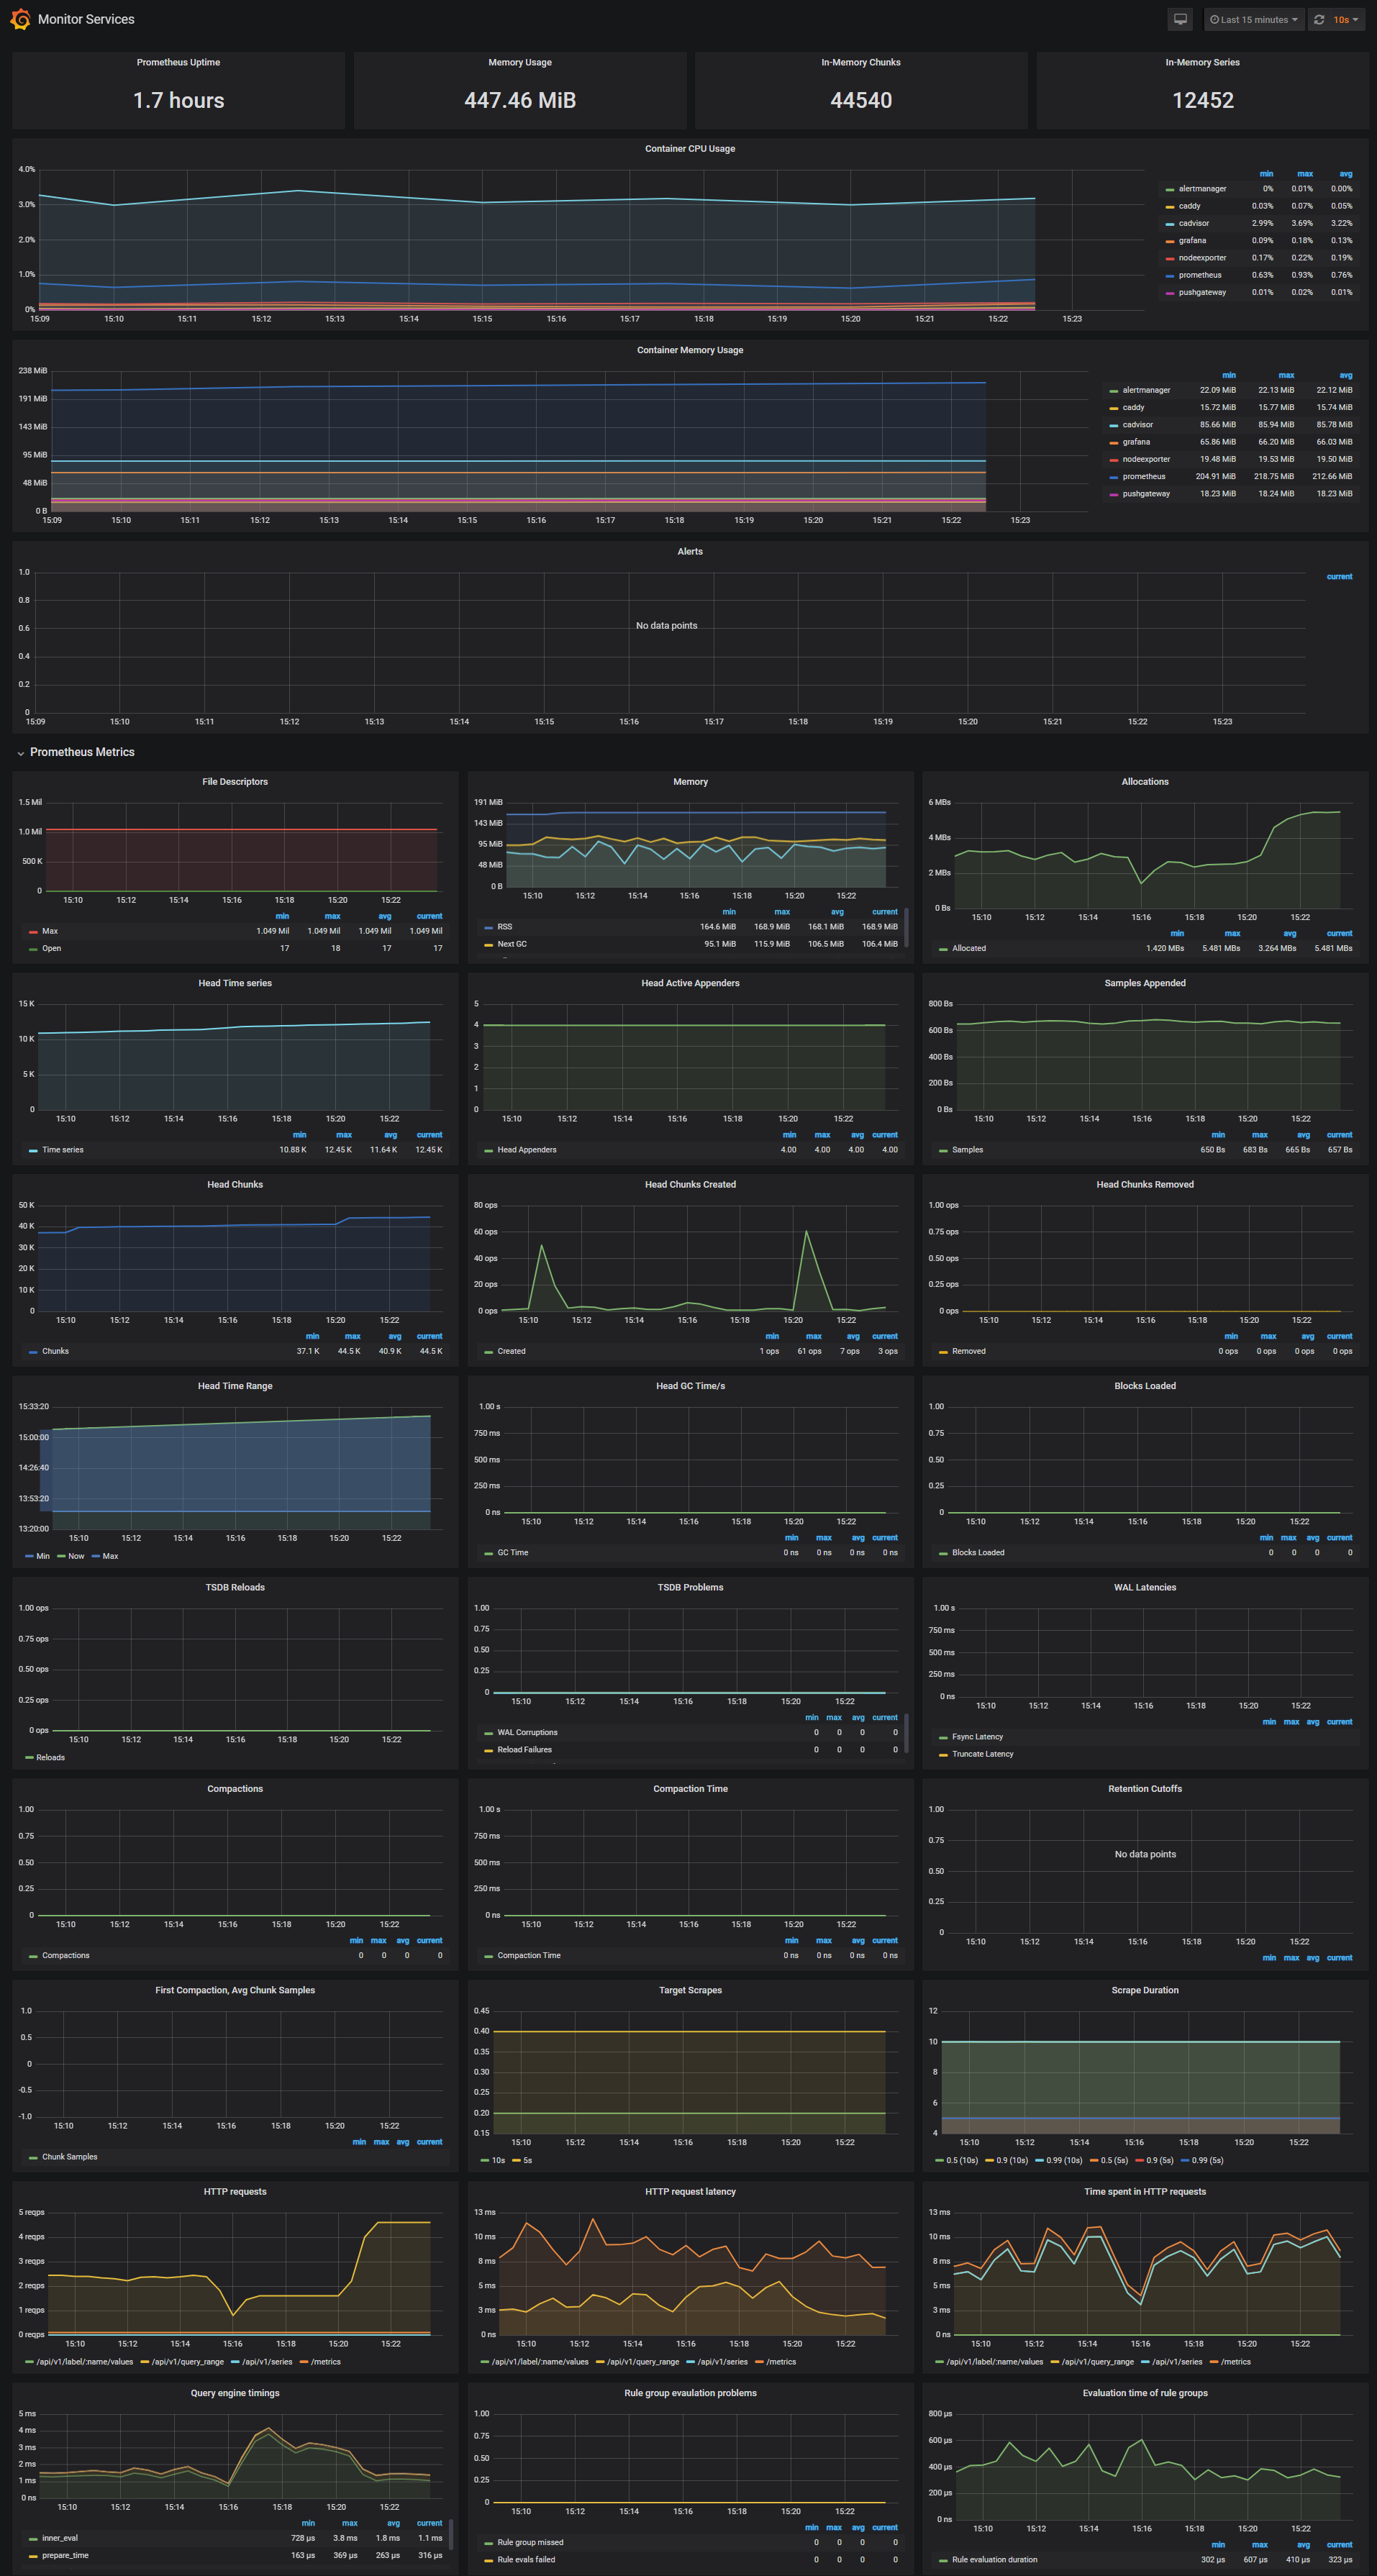
The Monitor Services Dashboard shows key metrics for monitoring the containers that make up the monitoring stack:
- Prometheus container uptime, monitoring stack total memory usage, Prometheus local storage memory chunks and series
- Container CPU usage graph
- Container memory usage graph
- Prometheus chunks to persist and persistence urgency graphs
- Prometheus chunks ops and checkpoint duration graphs
- Prometheus samples ingested rate, target scrapes and scrape duration graphs
- Prometheus HTTP requests graph
- Prometheus alerts graph
Define alerts
Three alert groups have been setup within the alert.rules configuration file:
- Monitoring services alerts targets
- Docker Host alerts host
- Docker Containers alerts containers
You can modify the alert rules and reload them by making a HTTP POST call to Prometheus:
curl -X POST http://admin:admin@<host-ip>:9090/-/reload
Monitoring services alerts
Trigger an alert if any of the monitoring targets (node-exporter and cAdvisor) are down for more than 30 seconds:
- alert: monitor_service_down
    expr: up == 0
    for: 30s
    labels:
      severity: critical
    annotations:
      summary: "Monitor service non-operational"
      description: "Service {{ $labels.instance }} is down."
Docker Host alerts
Trigger an alert if the Docker host CPU is under high load for more than 30 seconds:
- alert: high_cpu_load
    expr: node_load1 > 1.5
    for: 30s
    labels:
      severity: warning
    annotations:
      summary: "Server under high load"
      description: "Docker host is under high load, the avg load 1m is at {{ $value}}. Reported by instance {{ $labels.instance }} of job {{ $labels.job }}."
Modify the load threshold based on your CPU cores.
Trigger an alert if the Docker host memory is almost full:
- alert: high_memory_load
    expr: (sum(node_memory_MemTotal_bytes) - sum(node_memory_MemFree_bytes + node_memory_Buffers_bytes + node_memory_Cached_bytes) ) / sum(node_memory_MemTotal_bytes) * 100 > 85
    for: 30s
    labels:
      severity: warning
    annotations:
      summary: "Server memory is almost full"
      description: "Docker host memory usage is {{ humanize $value}}%. Reported by instance {{ $labels.instance }} of job {{ $labels.job }}."
Trigger an alert if the Docker host storage is almost full:
- alert: high_storage_load
    expr: (node_filesystem_size_bytes{fstype="aufs"} - node_filesystem_free_bytes{fstype="aufs"}) / node_filesystem_size_bytes{fstype="aufs"}  * 100 > 85
    for: 30s
    labels:
      severity: warning
    annotations:
      summary: "Server storage is almost full"
      description: "Docker host storage usage is {{ humanize $value}}%. Reported by instance {{ $labels.instance }} of job {{ $labels.job }}."
Docker Containers alerts
Trigger an alert if a container is down for more than 30 seconds:
- alert: jenkins_down
    expr: absent(container_memory_usage_bytes{name="jenkins"})
    for: 30s
    labels:
      severity: critical
    annotations:
      summary: "Jenkins down"
      description: "Jenkins container is down for more than 30 seconds."
Trigger an alert if a container is using more than 10% of total CPU cores for more than 30 seconds:
- alert: jenkins_high_cpu
    expr: sum(rate(container_cpu_usage_seconds_total{name="jenkins"}[1m])) / count(node_cpu_seconds_total{mode="system"}) * 100 > 10
    for: 30s
    labels:
      severity: warning
    annotations:
      summary: "Jenkins high CPU usage"
      description: "Jenkins CPU usage is {{ humanize $value}}%."
Trigger an alert if a container is using more than 1.2GB of RAM for more than 30 seconds:
- alert: jenkins_high_memory
    expr: sum(container_memory_usage_bytes{name="jenkins"}) > 1200000000
    for: 30s
    labels:
      severity: warning
    annotations:
      summary: "Jenkins high memory usage"
      description: "Jenkins memory consumption is at {{ humanize $value}}."
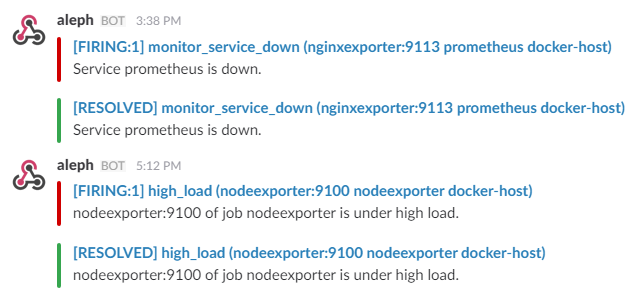
Setup alerting
The AlertManager service is responsible for handling alerts sent by Prometheus server. AlertManager can send notifications via email, Pushover, Slack, HipChat or any other system that exposes a webhook interface. A complete list of integrations can be found here.
You can view and silence notifications by accessing http://<host-ip>:9093.
The notification receivers can be configured in alertmanager/config.yml file.
To receive alerts via Slack you need to make a custom integration by choose incoming web hooks in your Slack team app page. You can find more details on setting up Slack integration here.
Copy the Slack Webhook URL into the api_url field and specify a Slack channel.
route:
    receiver: 'slack'

receivers:
    - name: 'slack'
      slack_configs:
          - send_resolved: true
            text: "{{ .CommonAnnotations.description }}"
            username: 'Prometheus'
            channel: '#<channel>'
            api_url: 'https://hooks.slack.com/services/<webhook-id>'
Sending metrics to the Pushgateway
The pushgateway is used to collect data from batch jobs or from services.
To push data, simply execute:
echo "some_metric 3.14" | curl --data-binary @- http://user:password@localhost:9091/metrics/job/some_job
Please replace the user:password part with your user and password set in the initial configuration (default: admin:admin).
Updating Grafana to v5.2.2
In Grafana versions >= 5.1 the id of the grafana user has been changed. Unfortunately this means that files created prior to 5.1 won’t have the correct permissions for later versions.
| Version | User | User ID |
|---|---|---|
| < 5.1 | grafana | 104 |
| >= 5.1 | grafana | 472 |
There are two possible solutions to this problem.
- Change ownership from 104 to 472
- Start the upgraded container as user 104
Specifying a user in docker-compose.yml
To change ownership of the files run your grafana container as root and modify the permissions.
First perform a docker-compose down then modify your docker-compose.yml to include the user: root option:
  grafana:
    image: grafana/grafana:5.2.2
    container_name: grafana
    volumes:
      - grafana_data:/var/lib/grafana
      - ./grafana/datasources:/etc/grafana/datasources
      - ./grafana/dashboards:/etc/grafana/dashboards
      - ./grafana/setup.sh:/setup.sh
    entrypoint: /setup.sh
    user: root
    environment:
      - GF_SECURITY_ADMIN_USER=${ADMIN_USER:-admin}
      - GF_SECURITY_ADMIN_PASSWORD=${ADMIN_PASSWORD:-admin}
      - GF_USERS_ALLOW_SIGN_UP=false
    restart: unless-stopped
    expose:
      - 3000
    networks:
      - monitor-net
    labels:
      org.label-schema.group: "monitoring"
Perform a docker-compose up -d and then issue the following commands:
docker exec -it --user root grafana bash

# in the container you just started:
chown -R root:root /etc/grafana && \
chmod -R a+r /etc/grafana && \
chown -R grafana:grafana /var/lib/grafana && \
chown -R grafana:grafana /usr/share/grafana
To run the grafana container as user: 104 change your docker-compose.yml like such:
  grafana:
    image: grafana/grafana:5.2.2
    container_name: grafana
    volumes:
      - grafana_data:/var/lib/grafana
      - ./grafana/datasources:/etc/grafana/datasources
      - ./grafana/dashboards:/etc/grafana/dashboards
      - ./grafana/setup.sh:/setup.sh
    entrypoint: /setup.sh
    user: "104"
    environment:
      - GF_SECURITY_ADMIN_USER=${ADMIN_USER:-admin}
      - GF_SECURITY_ADMIN_PASSWORD=${ADMIN_PASSWORD:-admin}
      - GF_USERS_ALLOW_SIGN_UP=false
    restart: unless-stopped
    expose:
      - 3000
    networks:
      - monitor-net
    labels:
      org.label-schema.group:
编辑推荐精选


酷表ChatExcel
大模型驱动的Excel数据处理工具
基于大模型交互的表格处理系统,允许用户通过对话方式完成数据整理和可视化分析。系统采用机器学习算法解析用户指令,自动执行排序、公式计算和数据透视等操作,支持多种文件格式导入导出。数据处理响应速度保持在0.8秒以内,支持超过100万行数据的即时分析。


DeepEP
DeepSeek开源的专家并行通信优化框架
DeepEP是一个专为大规模分布式计算设计的通信库,重点解决专家并行模式中的通信瓶颈问题。其核心架构采用分层拓扑感知技术,能够自动识别节点间物理连接关系,优化数据传输路径。通过实现动态路由选择与负载均衡机制,系统在千卡级计算集群中维持稳定的低延迟特性,同时兼容主流深度学习框架的通信接口。


DeepSeek
全球领先开源大模型,高效智能助手
DeepSeek是一家幻方量化创办的专注于通用人工智能的中国科技公司,主攻大模型研发与应用。DeepSeek-R1是开源的推理模型,擅长处理复杂任务且可免费商用。


问小白
DeepSeek R1 满血模型上线
问小白是一个基于 DeepSeek R1 模型的智能对话平台,专为用户提供高效、贴心的对话体验。实时在线,支持深度思考和联网搜索。免费不限次数,帮用户写作、创作、分析和规划,各种任务随时完成!


KnowS
AI医学搜索引擎 整合4000万+实时更新的全球医学文献
医学领域专用搜索引擎整合4000万+实时更新的全球医学文献,通过自主研发AI模型实现精准知识检索。系统每日更新指南、中英文文献及会议资料,搜索准确率较传统工具提升80%,同时将大模型幻觉率控制在8%以下。支持临床建议生成、文献深度解析、学术报告制作等全流程科研辅助,典型用户反馈显示每周可节省医疗工作者70%时间。


Windsurf Wave 3
Windsurf Editor推出第三次重大更新Wave 3
新增模型上下文协议支持与智能编辑功�能。本次更新包含五项核心改进:支持接入MCP协议扩展工具生态,Tab键智能跳转提升编码效率,Turbo模式实现自动化终端操作,图片拖拽功能优化多模态交互,以及面向付费用户的个性化图标定制。系统同步集成DeepSeek、Gemini等新模型,并通过信用点数机制实现差异化的资源调配。


腾讯元宝
腾讯自研的混元大模型AI助手
腾讯元宝是腾讯基于自研的混元大模型推出的一款多功能AI应用,旨在通过人工智能技术提升用户在写作、绘画、翻译、编程、搜索、阅读总结等多个领域的工作与生活效率。


Grok3
埃隆·马斯克旗下的人工智能公司 xAI 推出的第三代大规模语言模型
Grok3 是由埃隆·马斯克旗下的人工智能公司 xAI 推出的第三代大规模语言模型,常被马斯克称为“地球上最聪明的 AI”。它不仅是在前代产品 Grok 1 和 Grok 2 基础上的一次飞跃,还在多个关键技术上实现了创新突破。


OmniParser
帮助AI理解电脑屏幕 纯视觉GUI元素的自动化解析方案
开源工具通过计算机视觉技术实现图形界面元素的智能识别与结构化处理,支持自动化测试脚本生成和辅助功能开发。项目采用模块化设计,提供API接口与多种输出格式,适用于跨平台应用场景。核心算法优化了元素定位精度,在动态界面和复杂布局场景下保持稳定解析能力。


流畅阅读
AI网页翻译插件 双语阅读工具,还原母语级体验
流畅阅读是一款浏览器翻译插件,通过上下文智能分析提升翻译准确性,支持中英双语对照显示。集成多翻译引擎接口,允许用户自定义翻译规则和快捷键配置,操作数据全部存储在本地设备保障隐私安全。兼容Chrome、Edge、Firefox等主流浏览器,基于GPL-3.0开源协议开发,提供持续的功能迭代和社区支持。
推荐工具精选


AI云服务特惠
懂AI专属折扣关注微信公众号
最新AI工具、AI资讯
独家AI资源、AI项目落地

微信扫一扫关注公众号