
"处理14维空间中的超平面时,可视化一个3D空间并大声说'十四'。每个人都这么做。" - Geoff Hinton
概述
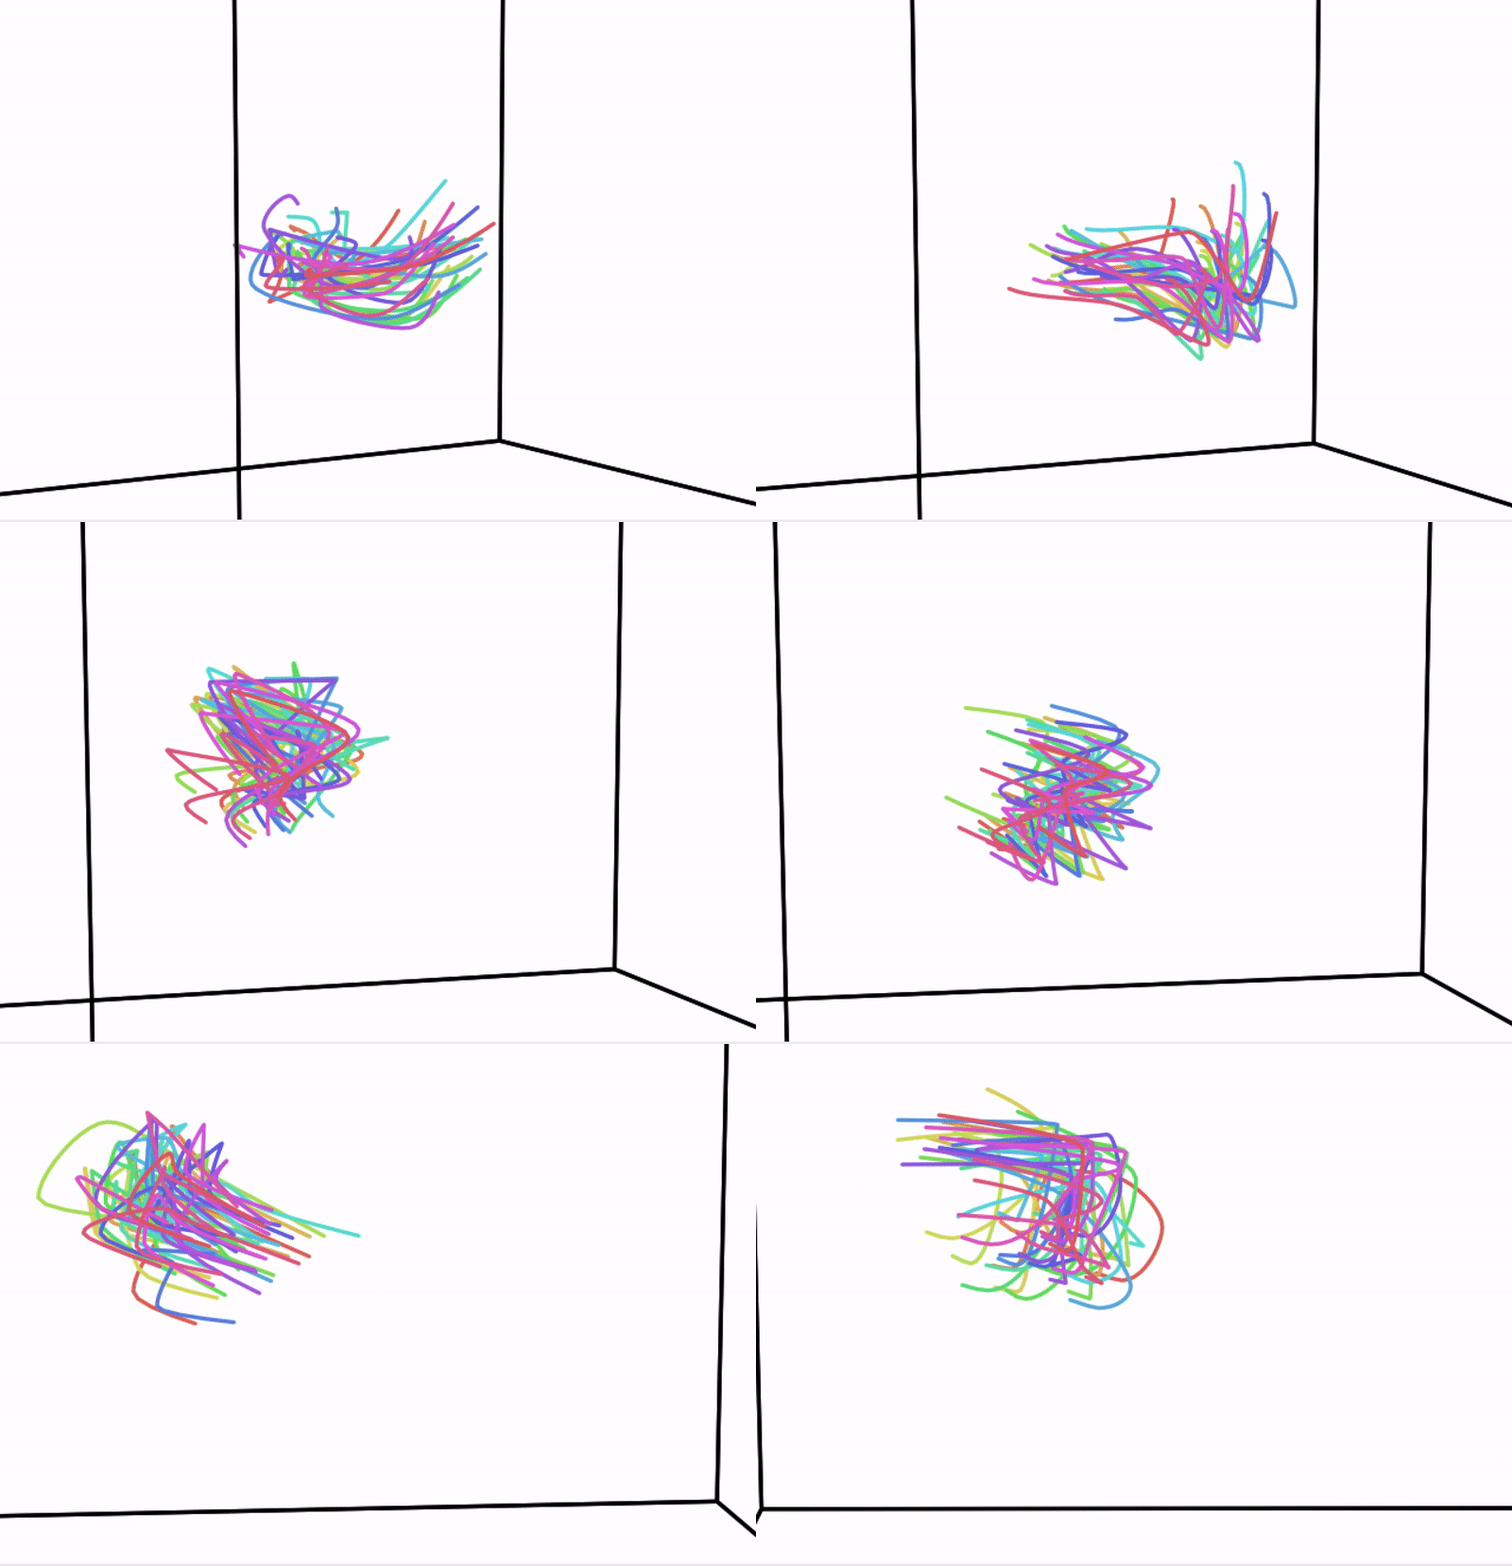
HyperTools旨在促进基于降维的高维数据可视化探索。基本流程是输入一个高维数据集(或一系列高维数据集),通过一次函数调用,降低数据集的维度并创建一个图表。该软件包建立在许多熟悉的工具之上,包括matplotlib、scikit-learn和seaborn。我们的软件包最近在Kaggle的No Free Hunch博客上得到了介绍。如需总体概览,您可能会发现这个演讲很有用(作为达特茅斯MIND暑期学校的一部分)。
立即尝试!
点击徽章启动一个包含示例用法的binder实例:
或者
查看HyperTools论文中的Jupyter notebooks仓库。
安装
要安装最新稳定版本,请运行:
pip install hypertools
要直接从GitHub安装最新不稳定版本,请运行:
pip install -U git+https://github.com/ContextLab/hypertools.git
或者,将仓库克隆到本地计算机:
git clone https://github.com/ContextLab/hypertools.git
然后,导航到文件夹并输入:
pip install -e .
(这些说明假设您的系统上已安装pip)
注意:如果您一直在使用0.5.0的开发版本,请清除您的数据缓存(/Users/yourusername/hypertools_data)。
要求
- python>=3.6
- PPCA>=0.0.2
- scikit-learn>=0.24.0
- pandas>=0.18.0
- seaborn>=0.8.1
- matplotlib>=1.5.1
- scipy>=1.0.0
- numpy>=1.10.4
- umap-learn>=0.4.6
- requests
- pytest(用于开发)
- ffmpeg(用于保存动画)
文档
查看我们的readthedocs页面以获取更多文档、完整的API详细信息和其他示例。
引用
我们为HyperTools撰写了一篇简短的JMLR论文,您可以在这里阅读,或者您可以查看(更长的)预印本。我们还有一个包含论文示例notebooks的仓库。
请引用为:
Heusser AC, Ziman K, Owen LLW, Manning JR (2018) HyperTools: A Python toolbox for gaining geometric insights into high-dimensional data. Journal of Machine Learning Research, 18(152): 1--6.
以下是bibtex格式的参考文献:
@ARTICLE {,
    author  = {Andrew C. Heusser and Kirsten Ziman and Lucy L. W. Owen and Jeremy R. Manning},
    title   = {HyperTools: a Python Toolbox for Gaining Geometric Insights into High-Dimensional Data},
    journal = {Journal of Machine Learning Research},
    year    = {2018},
    volume  = {18},
    number  = {152},
    pages   = {1-6},
    url     = {http://jmlr.org/papers/v18/17-434.html}
}
贡献
如果您想贡献,请先阅读我们的行为准则。
有关如何为项目做出贡献的具体信息,请参阅我们的贡献页面。
测试
要测试HyperTools,请安装pytest(pip install pytest)并在HyperTools文件夹中运行pytest
示例
点击这里查看更多示例。
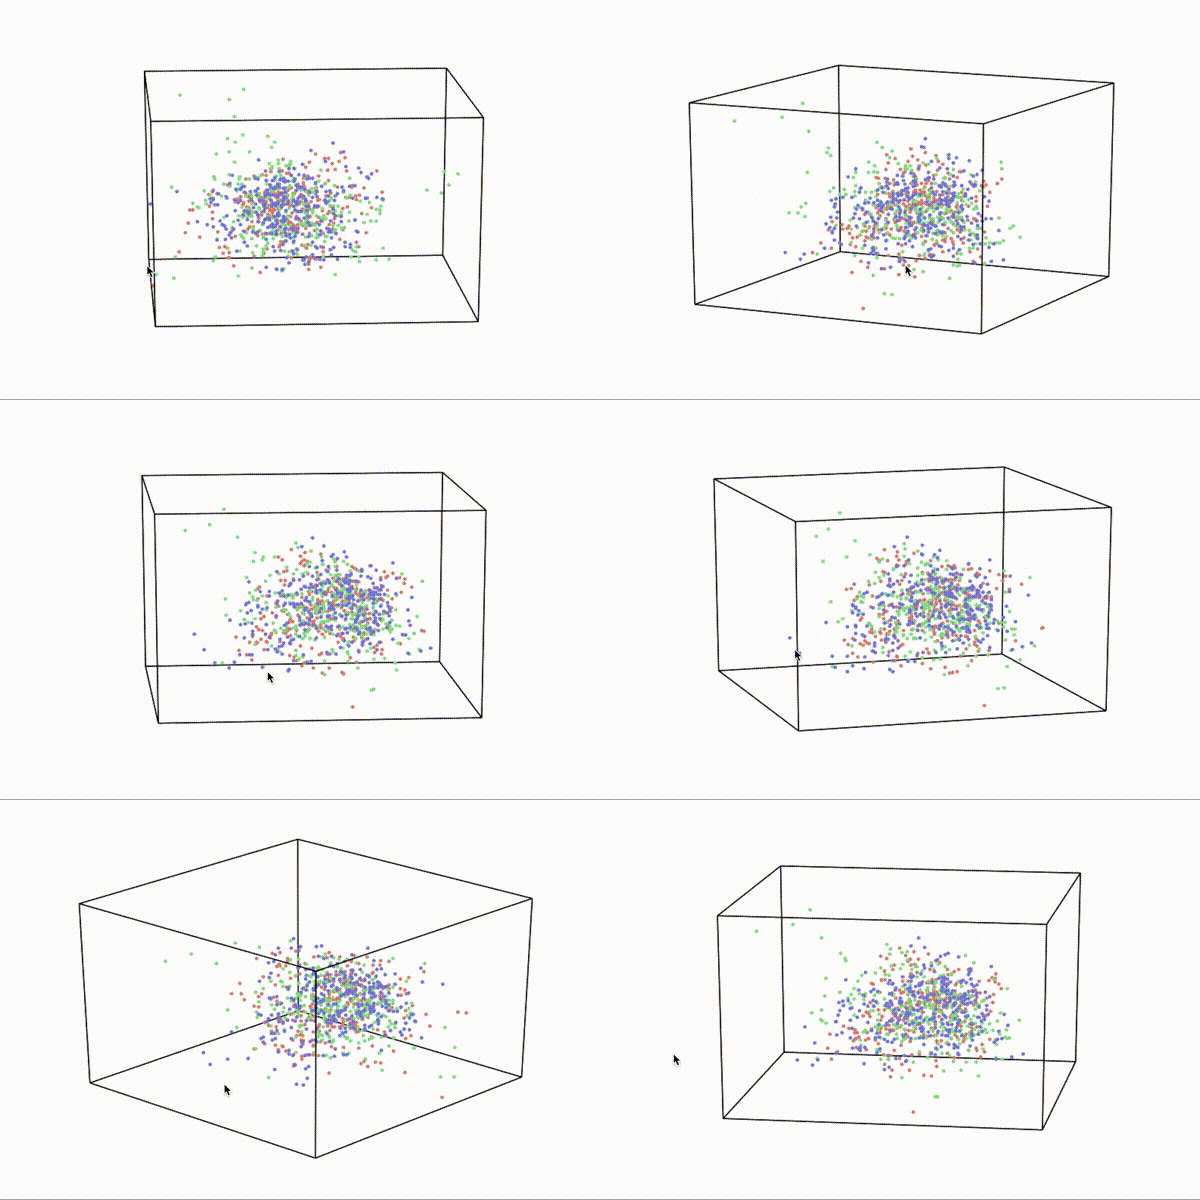
绘图
import hypertools as hyp
hyp.plot(list_of_arrays, '.', group=list_of_labels)
对齐
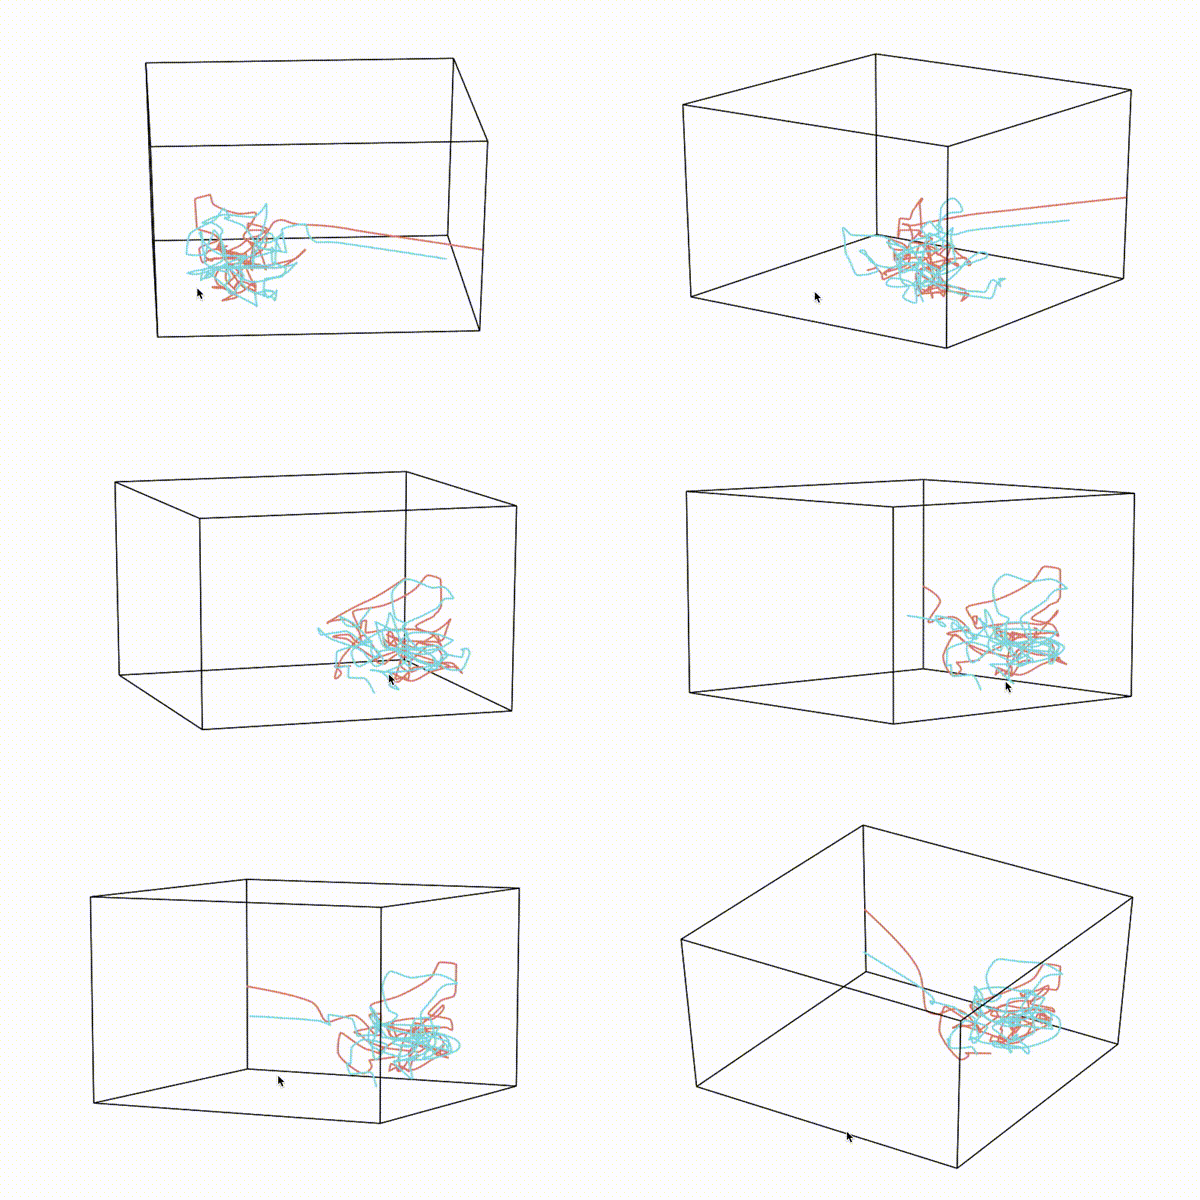
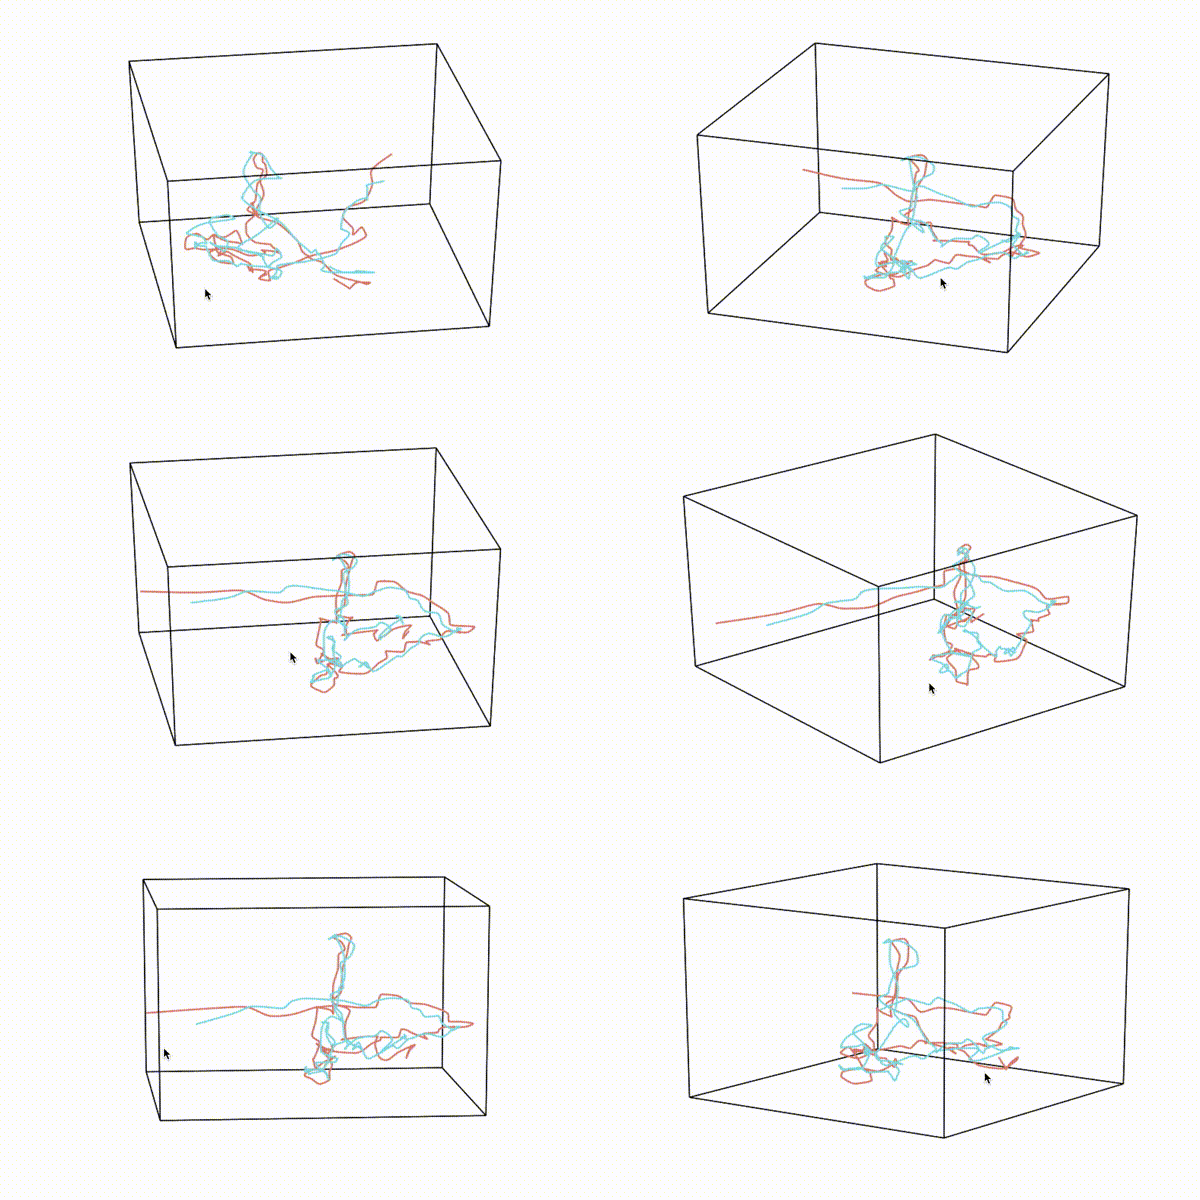
import hypertools as hyp
hyp.plot(list_of_arrays, align='hyper')
对齐前
对齐后
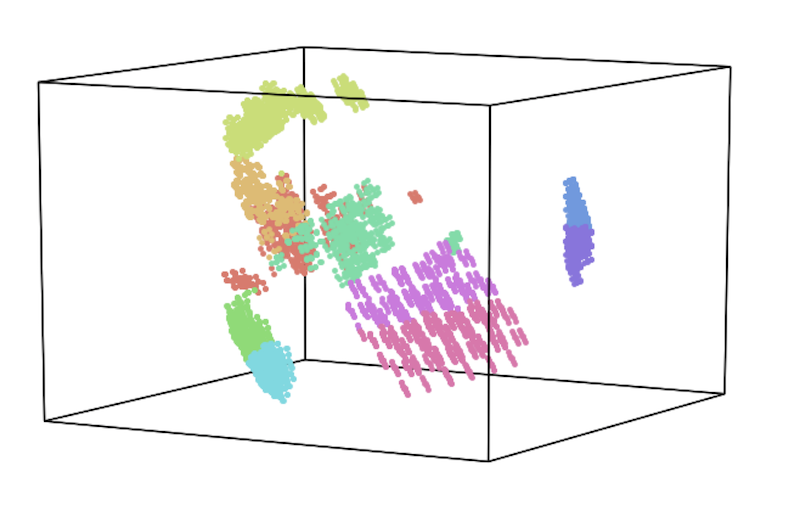
聚类
import hypertools as hyp
hyp.plot(array, '.', n_clusters=10)
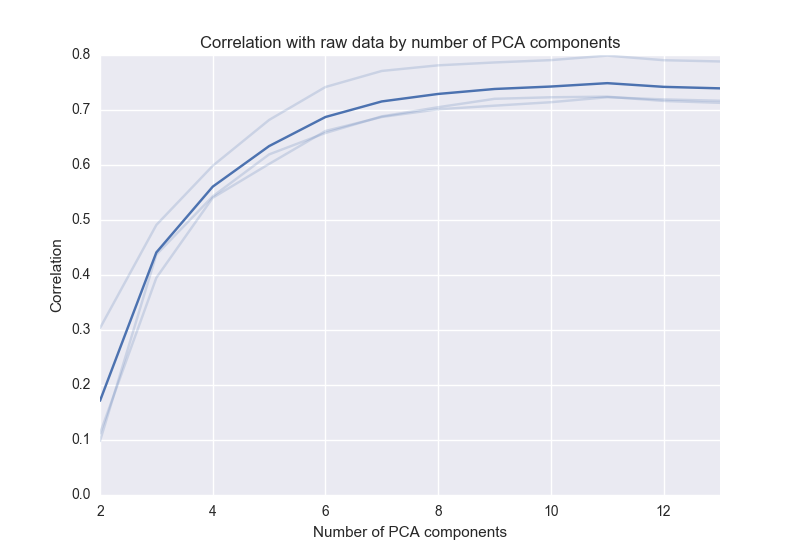
描述
import hypertools as hyp
hyp.tools.describe(list_of_arrays, reduce='PCA', max_dims=14)

 访问官网
访问官网 Github
 文档
文档 论文
论文


