tsmoothie
一个用于以向量化方式进行时间序列平滑和异常值检测的Python库。
概述
tsmoothie以快速高效的方式计算单个或多个时间序列的平滑。
可用的平滑技术包括:
- 指数平滑
- 卷积平滑,使用各种窗口类型(常数、汉宁、汉明、巴特利特、布莱克曼)
- 基于傅里叶变换的谱平滑
- 多项式平滑
- 各种类型的样条平滑(线性、立方、自然立方)
- 高斯平滑
- 装箱平滑
- LOWESS
- 各种类型的季节分解平滑(卷积、LOWESS、自然立方样条)
- 可自定义组件(水平、趋势、季节性、长期季节性)的卡尔曼平滑
tsmoothie提供平滑过程结果的区间计算。这对识别时间序列中的异常值和异常很有用。
根据所使用的平滑方法,可用的区间类型包括:
- sigma区间
- 置信区间
- 预测区间
- 卡尔曼区间
tsmoothie可以执行滑动平滑方法以模拟在线使用。这可以通过将时间序列分割成等大小的片段并独立平滑它们来实现。同样,这个功能通过WindowWrapper类以向量化方式实现。
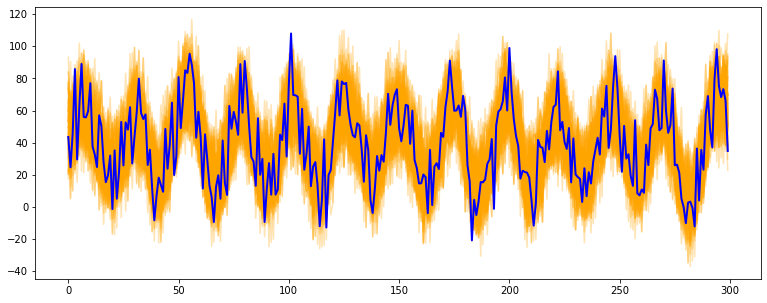
tsmoothie可以通过BootstrappingWrapper类进行时间序列自举。
支持的自举算法包括:
- 非重叠块自举
- 移动块自举
- 循环块自举
- 平稳自举
媒体
博客文章:
安装
pip install --upgrade tsmoothie
该模块仅依赖于NumPy、SciPy和simdkalman。支持Python 3.6或更高版本。
使用:平滑
以下是tsmoothie工作原理的几个示例。完整示例可在notebooks文件夹中找到。
# 导入库
import numpy as np
import matplotlib.pyplot as plt
from tsmoothie.utils_func import sim_randomwalk
from tsmoothie.smoother import LowessSmoother

# 生成3个长度为200的随机游走
np.random.seed(123)
data = sim_randomwalk(n_series=3, timesteps=200,
                      process_noise=10, measure_noise=30)

# 执行平滑
smoother = LowessSmoother(smooth_fraction=0.1, iterations=1)
smoother.smooth(data)

# 生成区间
low, up = smoother.get_intervals('prediction_interval')

# 绘制带区间的平滑时间序列
plt.figure(figsize=(18,5))
for i in range(3):
plt.subplot(1,3,i+1)
plt.plot(smoother.smooth_data[i], linewidth=3, color='blue')
plt.plot(smoother.data[i], '.k')
plt.title(f"时间序列 {i+1}"); plt.xlabel('时间')

plt.fill_between(range(len(smoother.data[i])), low[i], up[i], alpha=0.3)

```python
# 导入库
import numpy as np
import matplotlib.pyplot as plt
from tsmoothie.utils_func import sim_seasonal_data
from tsmoothie.smoother import DecomposeSmoother
# 生成3个长度为300的周期性时间序列
np.random.seed(123)
data = sim_seasonal_data(n_series=3, timesteps=300,
freq=24, measure_noise=30)
# 执行平滑操作
smoother = DecomposeSmoother(smooth_type='lowess', periods=24,
smooth_fraction=0.3)
smoother.smooth(data)
# 生成区间
low, up = smoother.get_intervals('sigma_interval')
# 绘制带区间的平滑时间序列
plt.figure(figsize=(18,5))
for i in range(3):
plt.subplot(1,3,i+1)
plt.plot(smoother.smooth_data[i], linewidth=3, color='blue')
plt.plot(smoother.data[i], '.k')
plt.title(f"时间序列 {i+1}"); plt.xlabel('时间')
plt.fill_between(range(len(smoother.data[i])), low[i], up[i], alpha=0.3)

所有可用的平滑器都可以与sklearn完全集成(参见此处)。
用法:bootstrap
# 导入库
import numpy as np
import matplotlib.pyplot as plt
from tsmoothie.utils_func import sim_seasonal_data
from tsmoothie.smoother import ConvolutionSmoother
from tsmoothie.bootstrap import BootstrappingWrapper

# 生成一个长度为300的周期性时间序列
np.random.seed(123)
data = sim_seasonal_data(n_series=1, timesteps=300,
                         freq=24, measure_noise=15)

# 执行引导程序
bts = BootstrappingWrapper(ConvolutionSmoother(window_len=8, window_type='ones'),
                           bootstrap_type='mbb', block_length=24)
bts_samples = bts.sample(data, n_samples=100)

# 绘制引导时间序列
plt.figure(figsize=(13,5))
plt.plot(bts_samples.T, alpha=0.3, c='orange')
plt.plot(data[0], c='blue', linewidth=2)

参考文献
- 多项式、样条、高斯和分箱平滑是通过在自定义基函数展开上构建回归来实现的。这些实现基于Matthew Drury提出的出色见解,可在此处查看
- 《使用不可观测组件的时间序列建模》,作者:Matteo M. Pelagatti
- 《时间序列分析中的自助法》,作者:Fanny Bergström,斯德哥尔摩大学

 访问官网
访问官网 Github
 文档
文档 论文
论文


